The “Secret Sauce” of Twitter Analytics

When it comes to your online presence, Twitter can be one of the most effective ways to reach your communities and audiences. With a focus on news and information, this 140-character platform has the potential to build a strong, loyal following. But most of the time, businesses, organizations and individuals fail to build a strategy and plan for this platform. Unfortunately, many brands simply “shoot in the dark,” without truly taking time to find a voice, create effective content and engage and build their communities. But tweets should never be left to chance. All your online content should be strategic, calculated and purposeful. Thankfully, Twitter offers a free, built-in data tracking tool called Twitter Analytics, which allows you to track, measure and adapt your posts for optimal engagement.
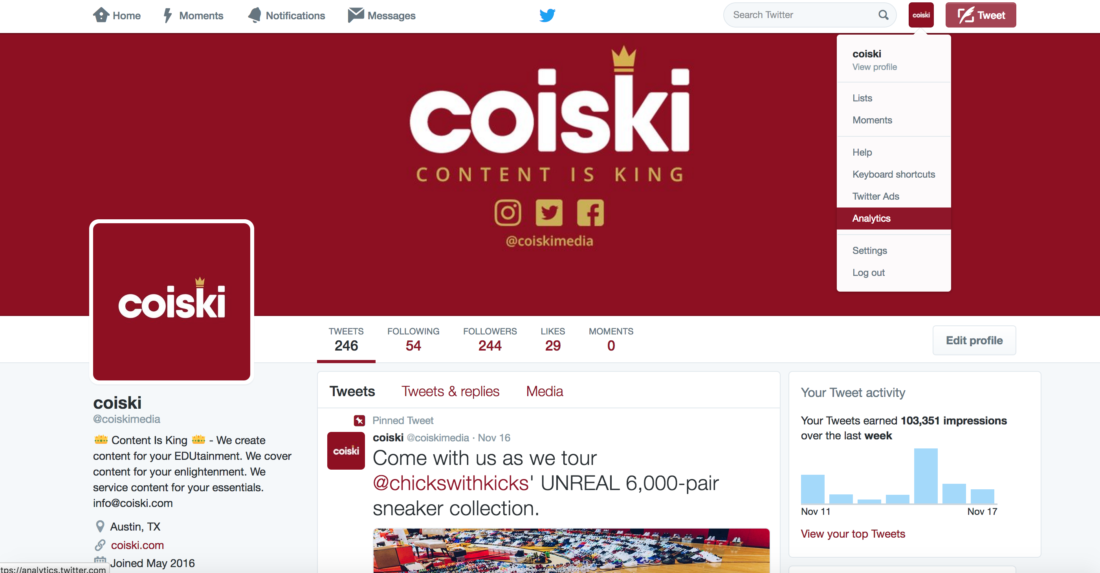
Because it is already installed on every Twitter account, Twitter Analytics has been measuring your tweets since the day you created your account. So, there’s no installation or activation required. However, it is only available from a desktop browser. To get started, simply click on your profile, and select Analytics. Or, visit analytics.twitter.com and login with your Twitter account. Now, it’s time to harness the power of your data!
Dashboard
When you initially login to Twitter Analytics, you will see a 28-day summary of your tweets, total impressions, profile visits, mentions, followers and tweets linking to you. This dashboard provides you a bird’s eye view of your monthly content, which is a great place to find any major spikes or outliers in your overall twitter posts. This is often where you can determine how viral your posts have gotten and how many people were influenced by them. As you scroll down on the dashboard, Twitter Analytics provides you with month-by-month previews of your top mentions, top tweets, top follower, top media tweet and more. Some of these data points can also be expanded to discover even more information about them, such as media engagement, replies and likes. Your dashboard is the perfect place for you to get started with analyzing your effectiveness.
What to look for: Impressions give you the number of people who have most likely seen your tweet in their feed. While followers come and go, impressions give you a solid indication of how effective your weekly, monthly or quarterly content has been. Compare impressions by month, and consider why that number could be going up or down.
Tweets
The next option on Twitter Analytics is the ‘Tweets’ screen. Think of this interface as a deep-dive into your impressions. Tweets not only shows you Engagements (link clicks, retweets, likes, replies), but it also provides you with your Engagement rate (ratio of engagements versus total impressions). Obviously, the higher your engagement rate, the more effective your content has been at interacting with your audience. You don’t want users to simply see your tweets – you want them to engage (click, like, retweet). From here, you can also rank by all tweets, Top Tweets, Tweets and Replies and even Promoted tweets. Scroll through your engagement rates, and consider why and how certain tweets were more engaging than others. Perhaps it was the time of day, or a certain hashtag you used that made it so popular? Likewise, maybe the lack of a link was the culprit as to why not many people retweeted or clicked on your tweet.
The true power of the Tweets screen comes from exporting your data (top right), downloading it and analyzing it in a spreadsheet. Twitter Analytics provides you with a neat, clean .csv file which can be opened with Excel, Google Sheets or any other spreadsheet application. Depending on your goals, you can then analyze over 30 different data points, such as time of day, profile clicks and even app downloads. In your spreadsheet application, these categories can be sorted, reorganized, visualized in a table or chart, to see your data in a new light.
What to look for: Sorting your data by Engagements, Replies, URL Clicks, and Media Views. Those categories provide you with the most information on who’s actually engaging with your brand and converting to your website or digital content. While the number of total impressions can be impressive, your most valued metrics are those that give you insight into who’s truly engaging with you as a brand. You may even compare those with time of day and other factors such as length of tweet or profile clicks. When analyzing your data, there’s no one formula for defining “success,” except for those goals you set for yourself. For example, if your goal is to connect deeply with your followers, shoot for replies, URL clicks and detail expands. If you just want more followers, look for retweets, likes and profile views. Analyzing your content can be difficult, but payoffs can be huge.
Audiences
The third option provided by Twitter Analytics is insight into your audience. In the “information age” where your audience has a wide range of options for news gathering and spending their time, it is increasingly important for you to understand who they are, why they came and what keeps them interested. Thankfully, the Audiences panel of Twitter Analytics provides data on All Twitter Users, your followers and your organic audience to help you create relevant, engaging and targeted social media content to the masses. Not only can you analyze your individual followers, but you can also compare them side-by-side with other audience groups.
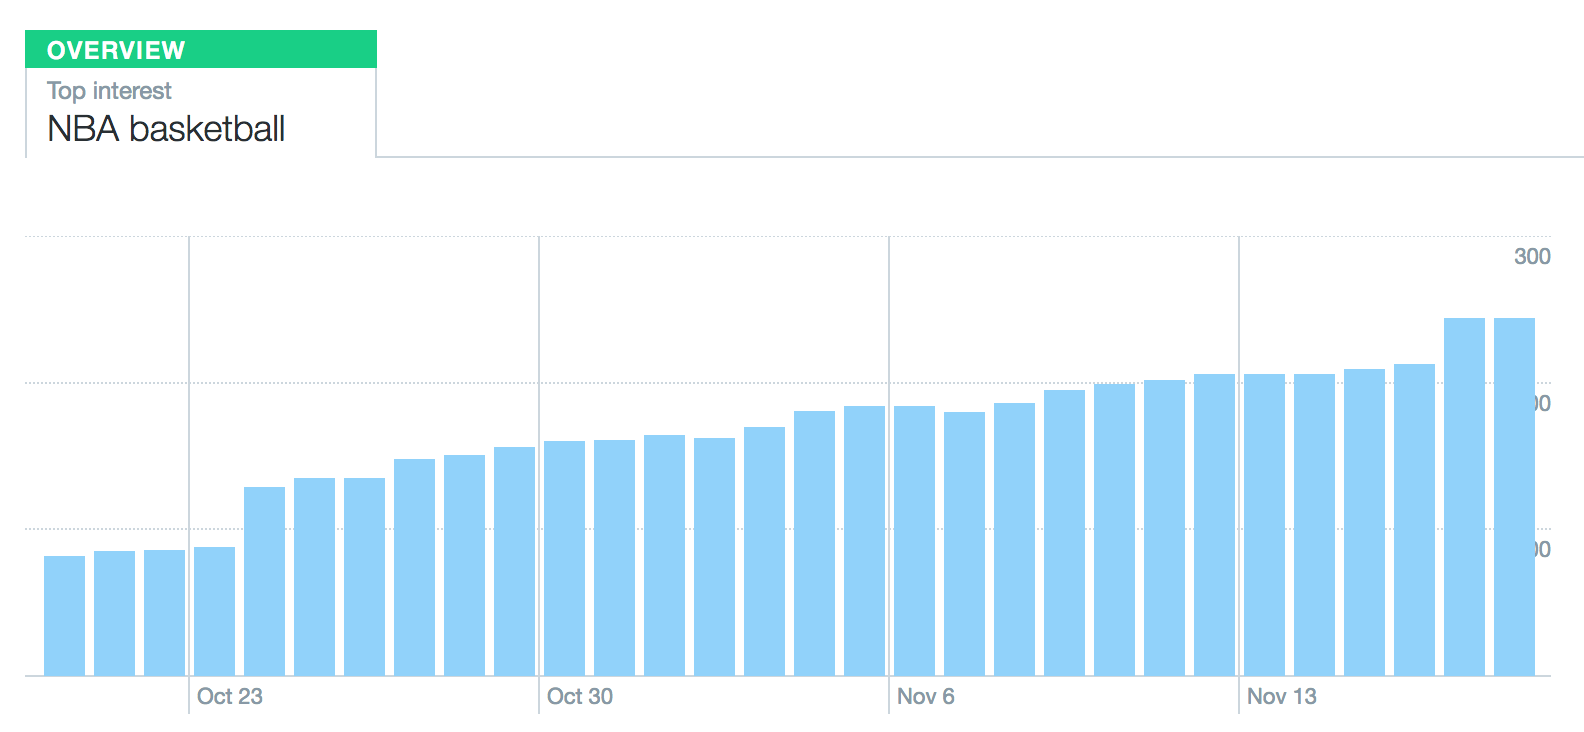
Beyond this, Audiences provides you with data-supported estimates on your audiences’ top interests like music, sports and entertainment. This can be extremely useful when leveraging pop culture or using memes for increased engagement. For example, if you see a large number of your audience is interested in NFL Football, it makes sense to provide game updates and scores. Or, understanding that 66% of all Twitter users identify with Comedy (movies and television) should give you permission to be funny and use a relevant meme. In this way, a hilarious tweet is not a “shot in the dark” – it’s a data-supported strategy.
What to look for: Tailor your content to the top three categories for your followers, as well as Twitter audiences in general. This will give you a good balance of relevant fan content, and it will help you attract new ones. Also, strongly consider the location and gender of your audience. A community-focused meme can go a long way. Twitter Analytics also provides estimated income levels, occupations and even consumer behaviors like whether or not they own a credit card or their designated wireless carrier. These details can be useful if you decide to run online offers or text-to-sign-up promotions.
Events
The Events tab can be very useful in connecting with your broader audiences. This panel provides insight into how often people on Twitter talk about certain holidays, sporting events, and cultural happenings across the globe. You can even click on specific dates, locations and event types to find items most relevant to you or your communities. Many events, such as holidays and recurring pop culture events also contain useful demographic data, which can be incredibly useful for planning your content, scheduling tweets and even tailoring your other digital content like blog posts or videos to later be promoted on Twitter. Recurring trends provide a grab bag of the most commonly used hashtags such as #TransformationTuesday and #FBF (Flashback Friday).
What to look for: Be sure to stay on top of upcoming events, especially for your area. Movie releases, sporting events and holidays are perfect opportunities to grab new audiences. Prepare memes and schedule your tweets, so you don’t miss out on new followers or engaging with your current fans.
Others
- Twitter Cards – With a little coding experience, you can create an engaging, rich media experience that drives traffic to your website. This is great for advertising. To learn more about these interactive features, click here.
- Videos (Beta) – This feature specifically manages the effectiveness of your videos. Surely, there will be more options to come, but currently you can view engagement rates and trends.
- App Manager – If you have an app, you can give Twitter permission to start tracking that, too!
- Conversion Tracking – Great for measuring user behavior and how often they “convert” to your website from Twitter. This feature also allows you to create groups for unique messaging and special offers.
The “secret sauce” of Twitter Analytics isn’t really the data at all – it all lies in analyzing and adapting your content. Simply having the data is one thing, but it’s up to you to actually measure and analyze its effectiveness as a brand. This doesn’t mean you have to check analytics every day, but start with a report every week. Beyond that, take time to truly understand why your followers are making the decisions they’re making. If something’s not working, pivot. If you succeeded at a goal, figure out why and how it happened. It’s not easy, but free tools like Twitter Analytics provides you and your team with valuable insight you never could have had otherwise.
One final note: Do not be afraid of failure! Try new things. Experiment with different types of content, and see how they do. There is no one-size-fits-all approach, but understanding your unique data can help you build your strategy and grow your audience like never before.